40 Fascinating Visuals Curated By The Brilliant Minds Behind ‘Information Is Beautiful’
In a world overloaded with information, clarity is a rare and precious thing. That’s what ‘Information Is Beautiful’ project aims to do. Created by David McCandless, this groundbreaking project transforms data into striking visualizations that not only inform, but also delight the eye. Whether it’s breaking down scientific studies, comparing global habits, or revealing surprising truths hidden in statistics, the team excels at one thing: making data digestible, compelling, and yes, beautiful.
At its core, Information Is Beautiful is about showing, not just telling. Instead of lengthy paragraphs or dull charts, the project uses clean, colorful, and creative visuals to uncover patterns, trends, and insights. A scroll through their work feels more like browsing a modern art gallery than reading a spreadsheet. Check out some of their amazing posts below.
More info: Facebook | Instagram | X | Books | InformationIsBeautiful.com#1 Lovely Chart Of Doggie Body Language
 Image source: informationisbeautiful, Lili Chin
#2 Classic Isotype Infographic From The 1940s
 Image source: informationisbeautiful
#3 Because Vaccines Work
 Image source: informationisbeautiful
#4 Truthpaste! Love This Labelling - Let's Roll It Out Across All Products
 Image source: informationisbeautiful
#5 Har Har Yes
 Image source: informationisbeautiful, art_storefronts
#6 Most Offensive Types Of Pillow Cases
 Image source: informationisbeautiful, beckybarnicomics
#7 Beautiful Elevation Art
 Image source: informationisbeautiful, cstats1
#8 In The First Half Of The 20th Century, Tens Of Thousands Of People (Mostly Children) Suffered Paralysis From Polio. The First Vaccine Was Introduced In The USA In 1955
 Image source: informationisbeautiful, ourworldindata
#9 Revealing Cross Section Of A Road In England
 Image source: informationisbeautiful
#10
 Image source: informationisbeautiful, Medium
#11 True? True
 Image source: informationisbeautiful
#12 Wait, Who Is My Third Cousin Twice Removed? Oh
 Image source: informationisbeautiful
#13 Periodic Table By Lickability
 Image source: informationisbeautiful, Wellihol
#14 How Rich People Avoid Paying Tax
 Image source: informationisbeautiful, newmoney.blog
#15 Love A Revealing Cut-Away! (From A London Transport Museum Poster By Gavin Dunn)
 Image source: informationisbeautiful
#16 Design Costs
 Image source: informationisbeautiful
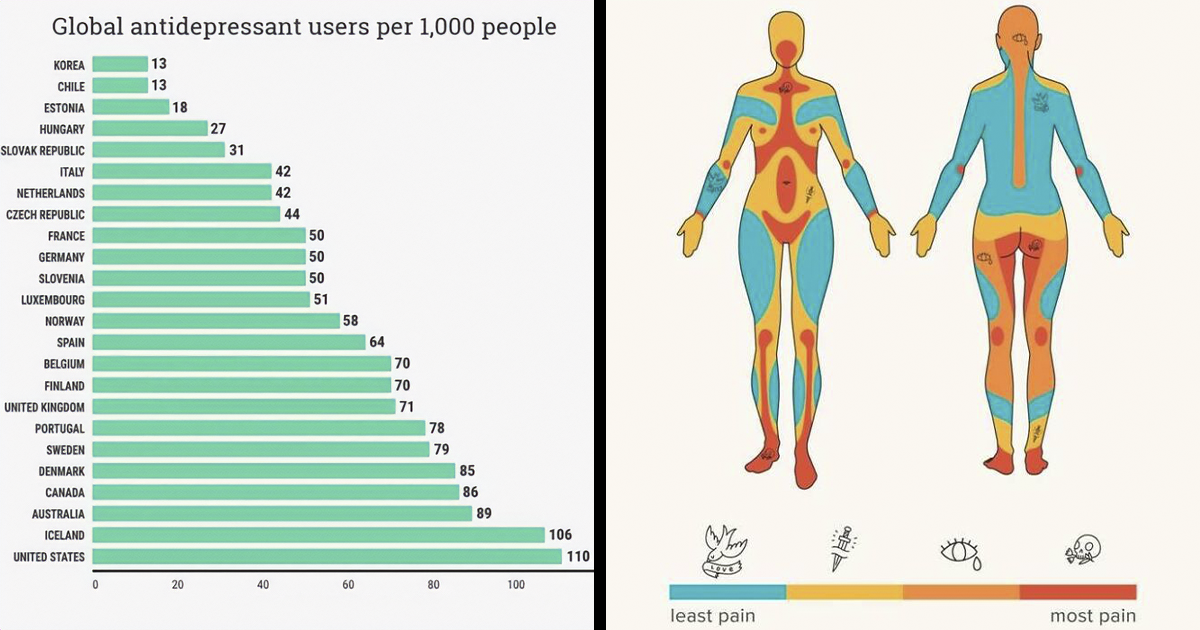
#17 Global Antidepressant Use
 Image source: informationisbeautiful
#18 One 18 Inch Pizza Has 'More Pizza' Than 2 X 12 Inch Pizzas!
 Image source: informationisbeautiful, fermatslibrary
#19 May I Present To You, The Potsdam Gravity Potato? Areas Of The Earth Where The Gravitational Field Is Mysteriously Weaker (Blue) Or Stronger (Orange)
 Image source: informationisbeautiful, earthlymission
#20 What Mood Will Your TV Detective Be In?
 Image source: informationisbeautiful, Alasdair Beckett-King
#21 Measurement Unit Differences Between The U.s.a. And Most Of The World
 Image source: informationisbeautiful
#22 Frequency Of Red Hair In Europe
 Image source: informationisbeautiful
#23 Telling. Quantity Of Male Versus Female Dialogue In Best Picture Films Of Recent Decades
 Image source: informationisbeautiful, puddingviz
#24 The World’s Solar Capacity Reached 1,419 Gigawatts In 2023, Way Beyond Any Predictions. 1 Gigawatt = Power For A Medium Sized City
 Image source: informationisbeautiful
#25 How Reliable Is The Us Weather Temperature Forecast? Didn't Know That About Florida
 Image source: informationisbeautiful
#26 Africa Is Big
 Image source: informationisbeautiful
#27 Rubbish? Fine? Brilliant? British Superlatives Graded And Ranked
 Image source: informationisbeautiful, yougov
#28 Yet Another Reason To Tut At The Mercator Map Projection
 Image source: informationisbeautiful, Brilliant Maps
#29 The Nearest Other Country...
 Image source: informationisbeautiful, amazingmap
#30 One Of Humanity's Greatest Achievements
 Image source: informationisbeautiful, informationisbeautiful
#31 Al-Barquq > Albercoc > Aubercot > Apricot
 Image source: informationisbeautiful
#32 Every Hotel Bar Ever
 Image source: informationisbeautiful, Matt Surelee Charts
#33 We Were Curious
 Image source: informationisbeautiful
#34 How The World Will Look In 250 Million Years
 Image source: informationisbeautiful, Individual-Sun-9426
#35 Ever Heard Of The Butter Line?
 Image source: informationisbeautiful
#36 Damn ... How Far Bilbo And Frodo Actually Walked (If The Shire Is Kansas, Mordor Is Jacksonville)
 Image source: informationisbeautiful, fussomoro
#37 What’s Actually Worth Doing To Make A Climate Difference, According To Data?
 Image source: informationisbeautiful, informationisbeautiful
#38 How The Concept Of Marriage Has Changed Across Centuries
 Image source: informationisbeautiful
#39 If You're Aged 30 Or More, Then 50% Of All Human Fossil Fuel Emissions Happened During Your Lifetime
 Image source: informationisbeautiful
#40 Woah Australia - Global Cancer Rates In People Under 50
 Image source: informationisbeautiful, World Health Org
With 5+ years in the creator, entertainment, and publishing spaces, Demilked shortlists, reviews, and ranks leading tools that actually make your life easier.