25 Maps That Make Statistical Data Fun And Interesting
Fascinating maps sharing insightful stats and data on the world.
Independently testedUnbiased Demilked scoreFree to implementTools included
Most of the numbers that describe our world live buried in archived reports and obscure databases that we’d never bother to search for, let alone read. But turn those stats into smart, well-designed maps, and suddenly they become addictive little snippets of insightful trivia distilled in an easily accessible manner.
From where people actually move and settle, to how our habits, jobs, and even quirks cluster across the globe, these informative maps transform dry data into visuals you can grasp in a second and remember for much longer. Here are a few fun data maps shared on a dedicated cartography enthusiasts Reddit community, where art, math and tech are combined to turn obscure statistics into a surprisingly fun format that reveals fascinating stories about the world we live in.
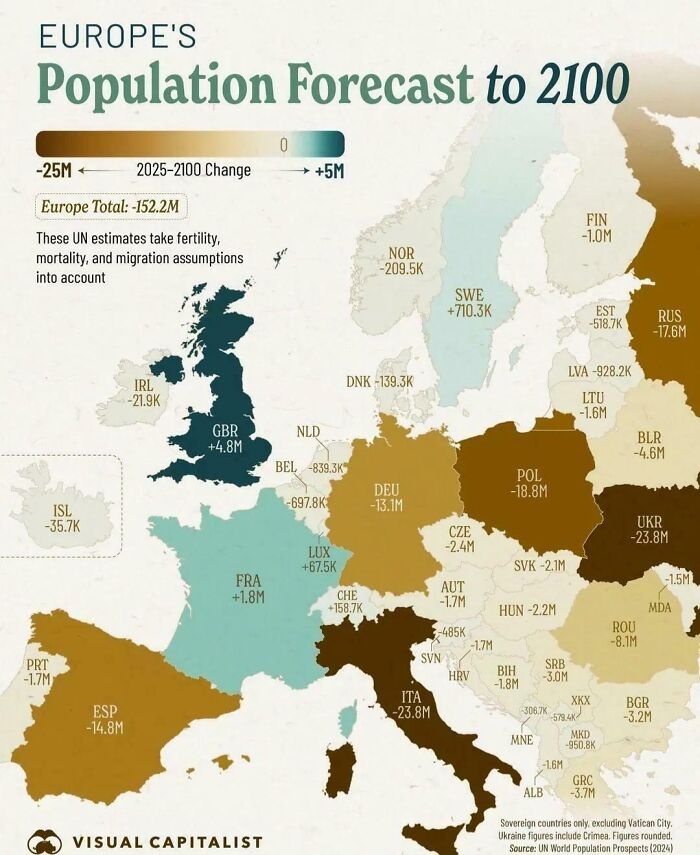 Image source: QuartzXOX
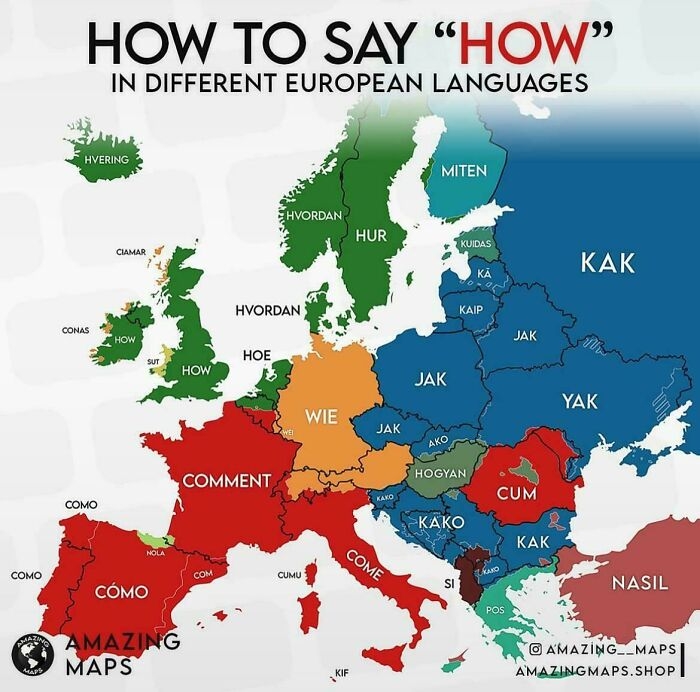 Image source: montecristolord
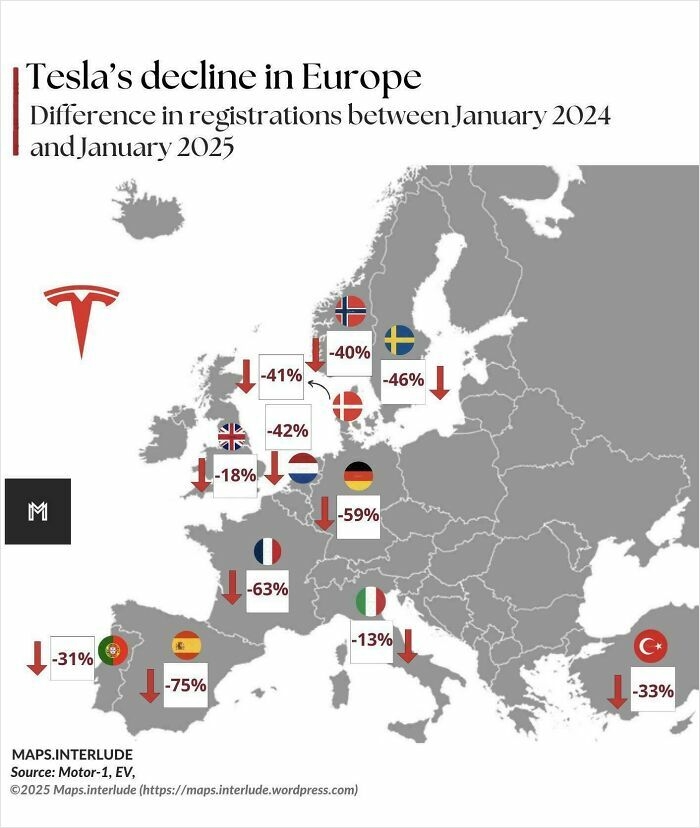 Image source: quindiassomigli
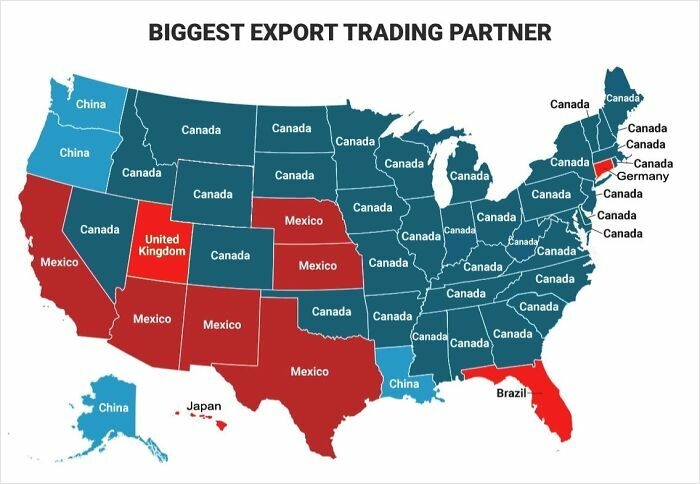 Image source: MansterSoft
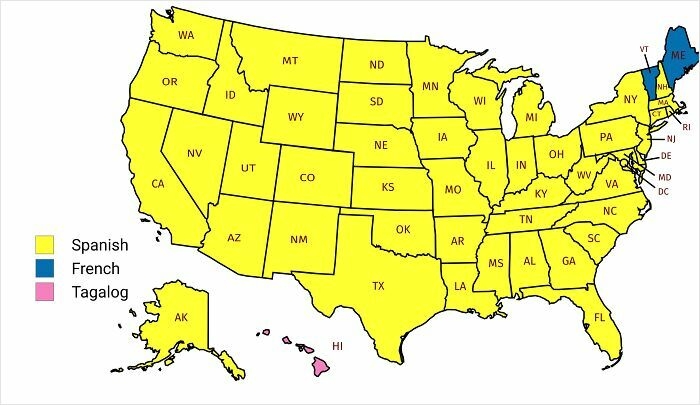 Image source: Few_Introduction9919
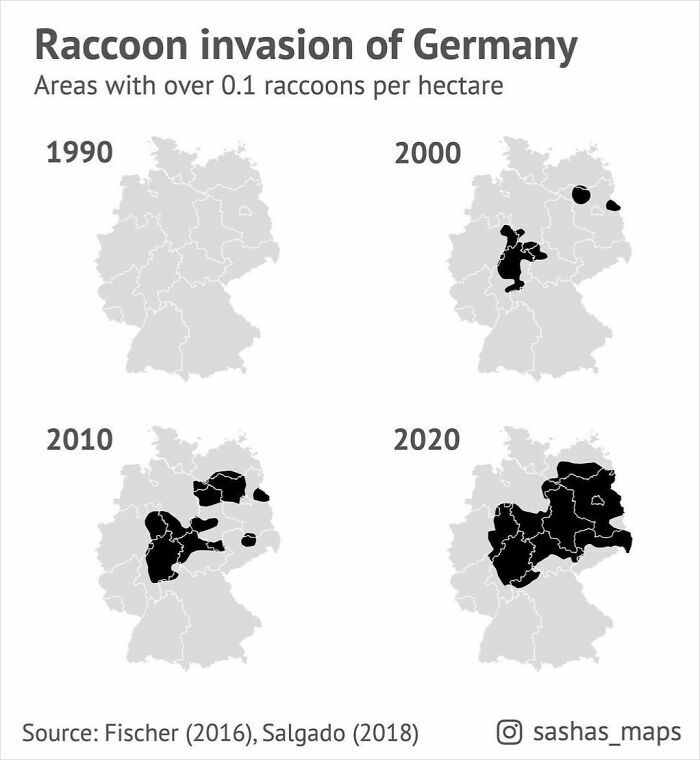 Image source: BrownRepresent
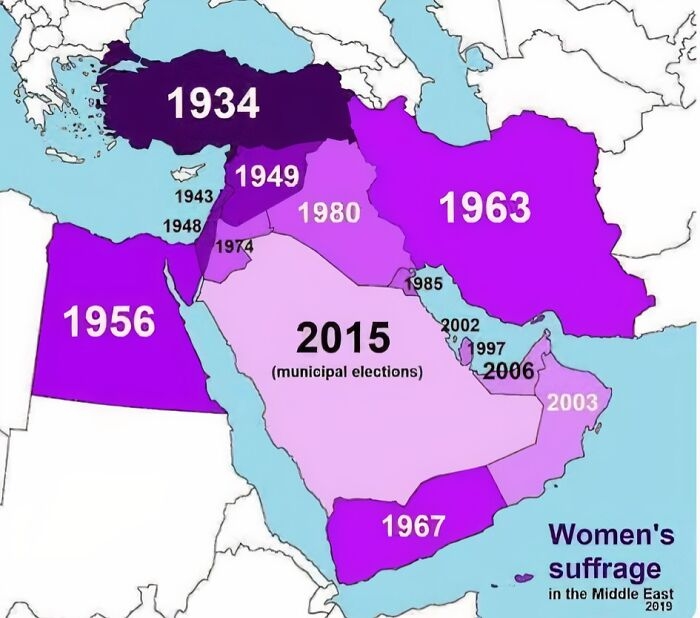 Image source: throwaway4457877
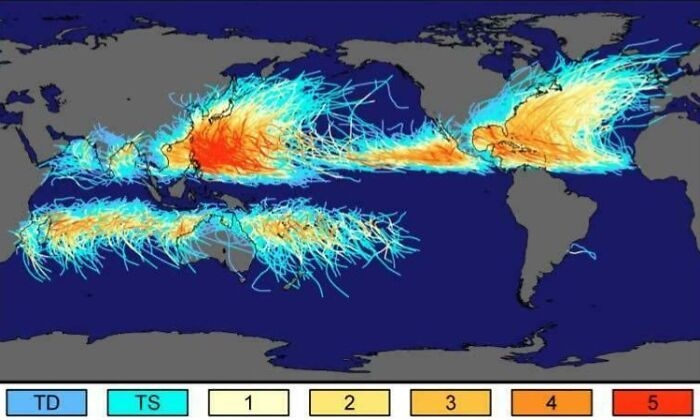 Image source: spyalien
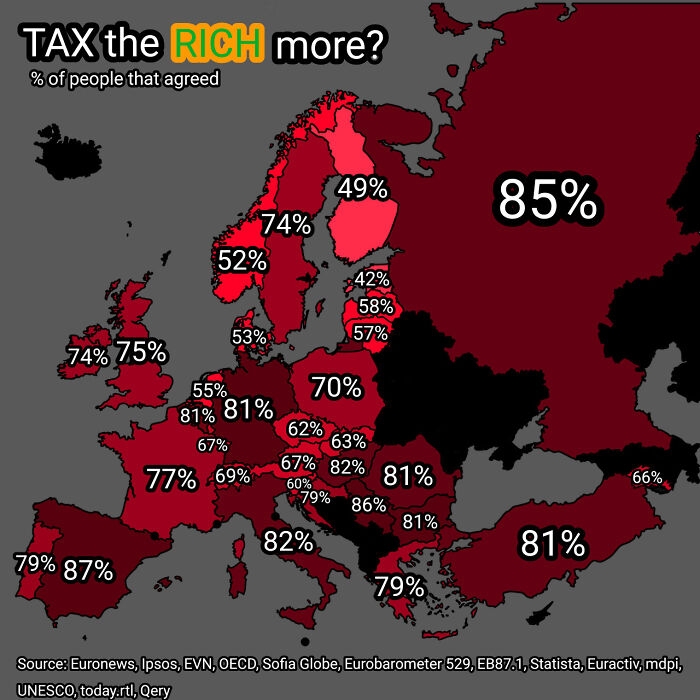 Image source: Alarmed_Wish3294
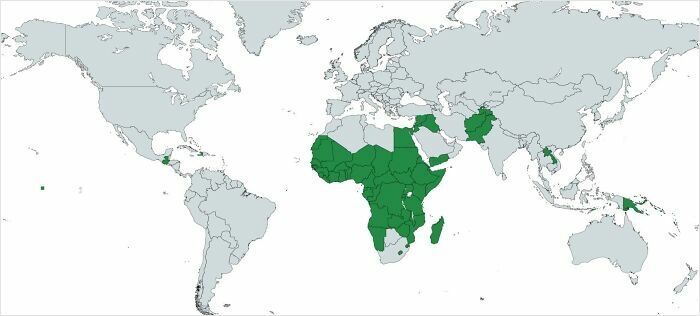 Image source: OppositeRock4217
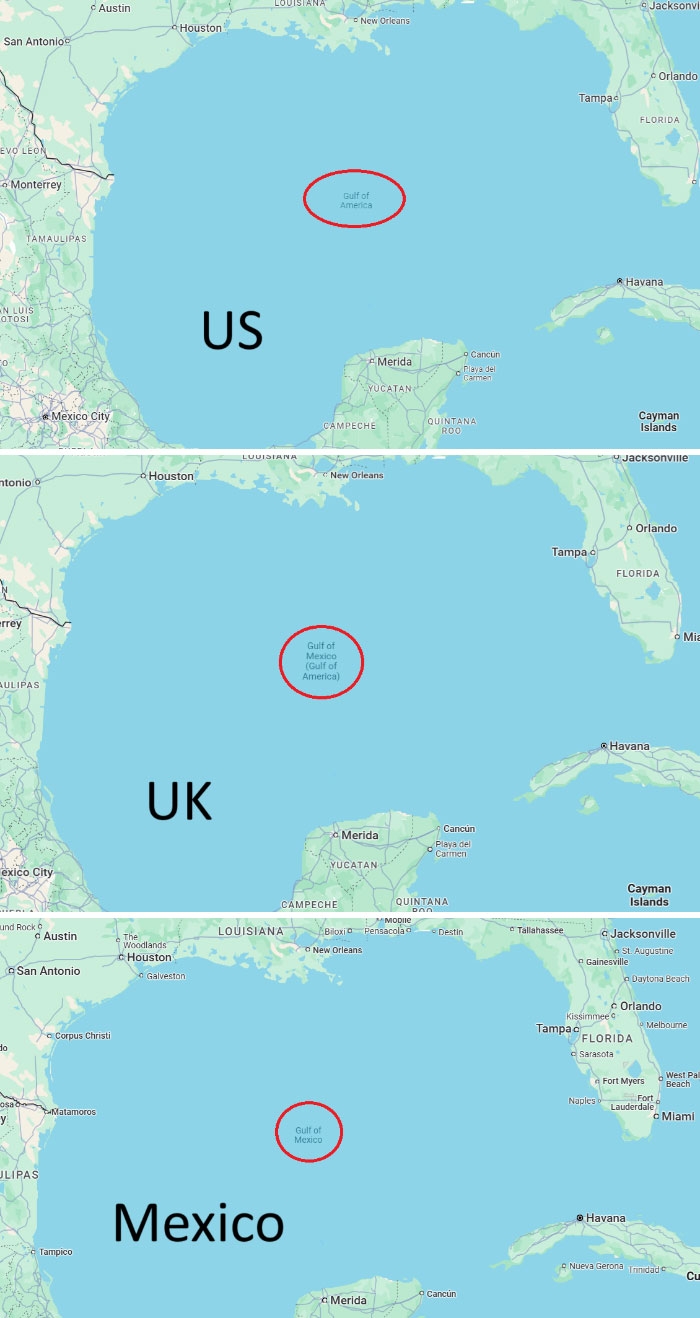 Image source: beavershaw
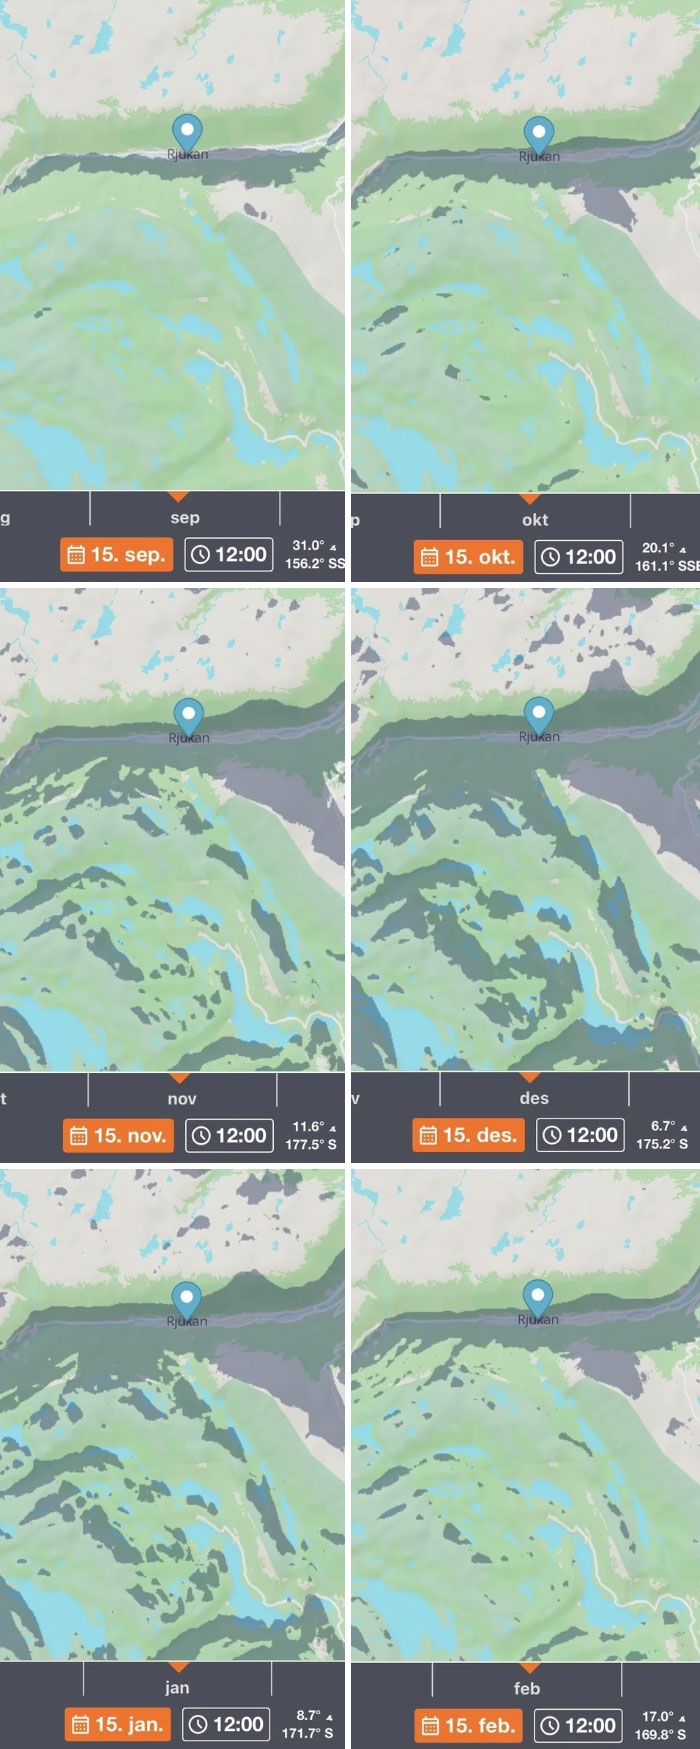 Image source: Vitboi
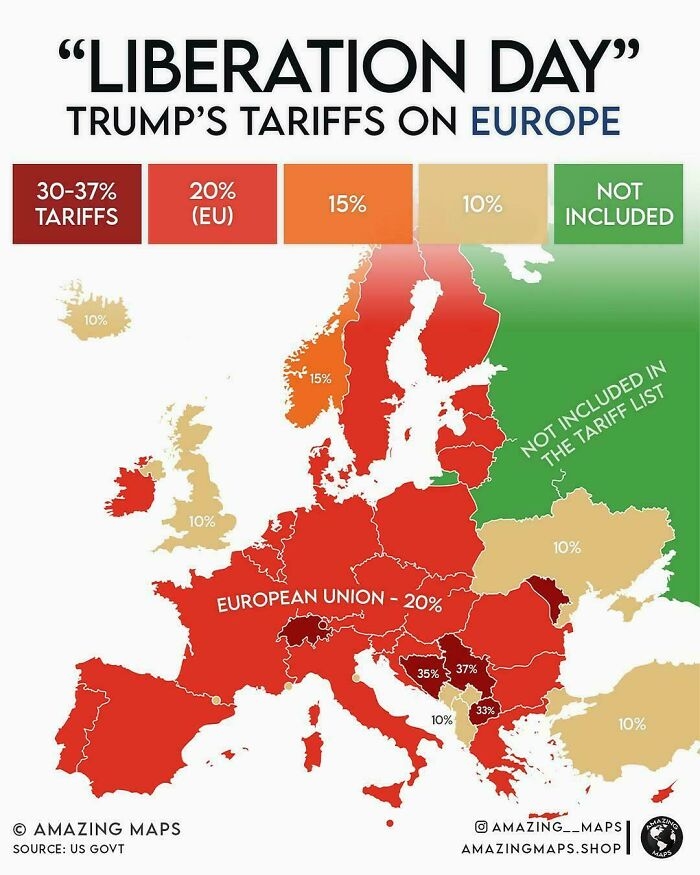 Image source: sh1kora
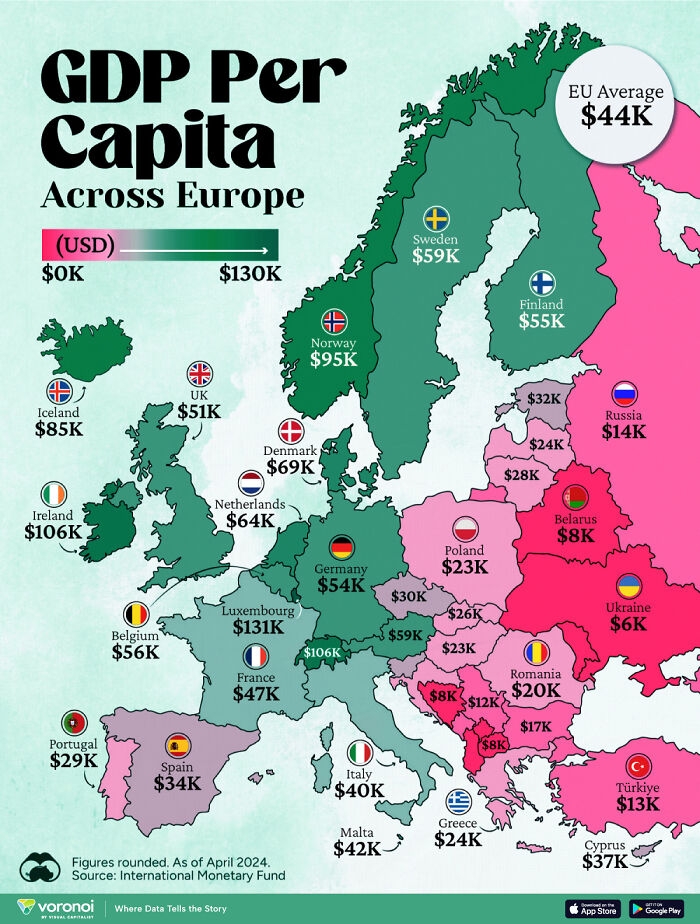 Image source: Middle-Stuff1355
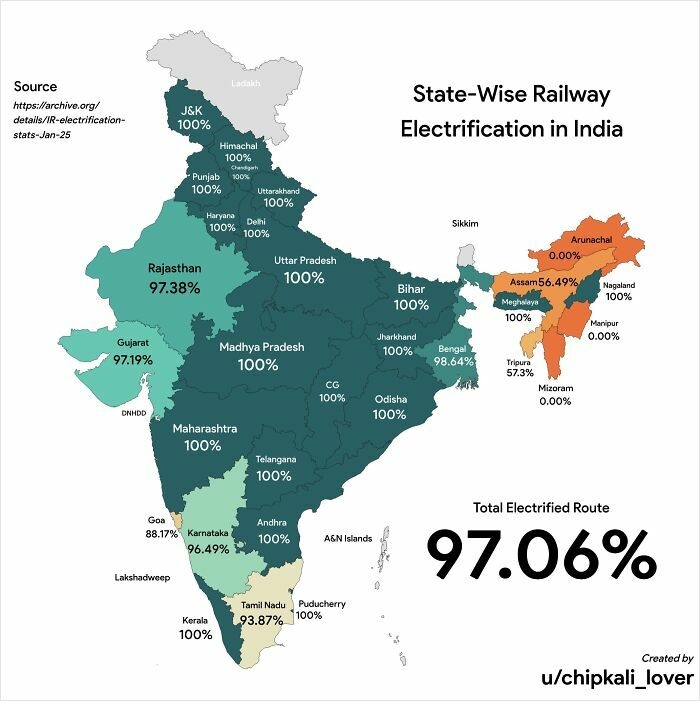 Image source: chipkali_lover
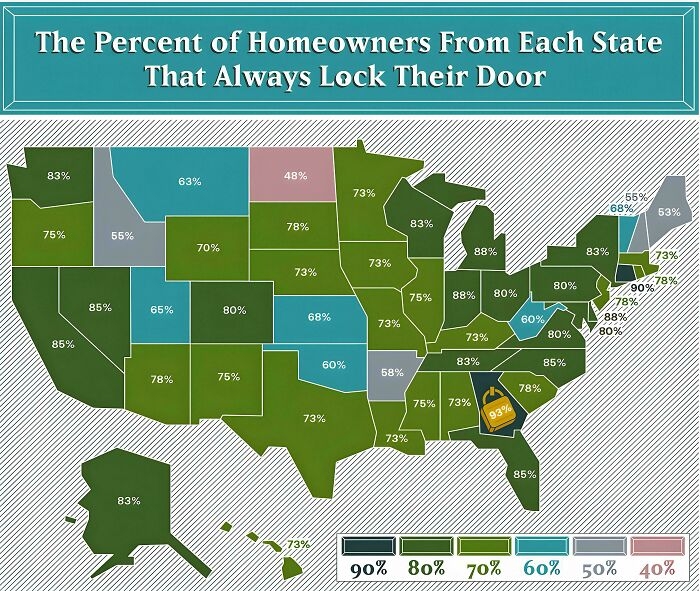 Image source: LuckyTraveler88
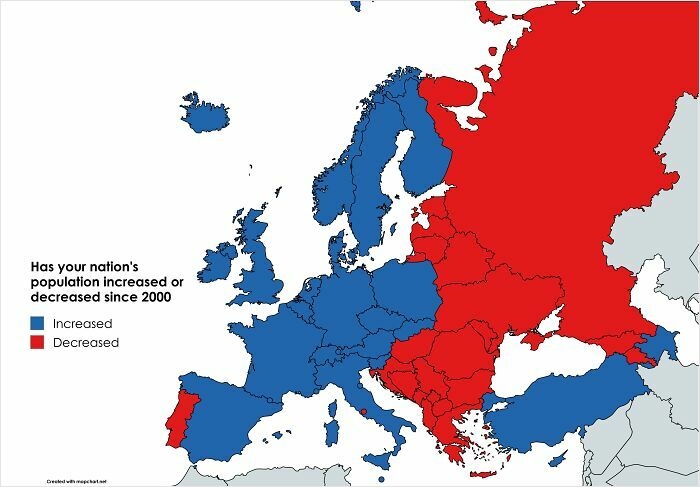 Image source: ExcitingNeck8226
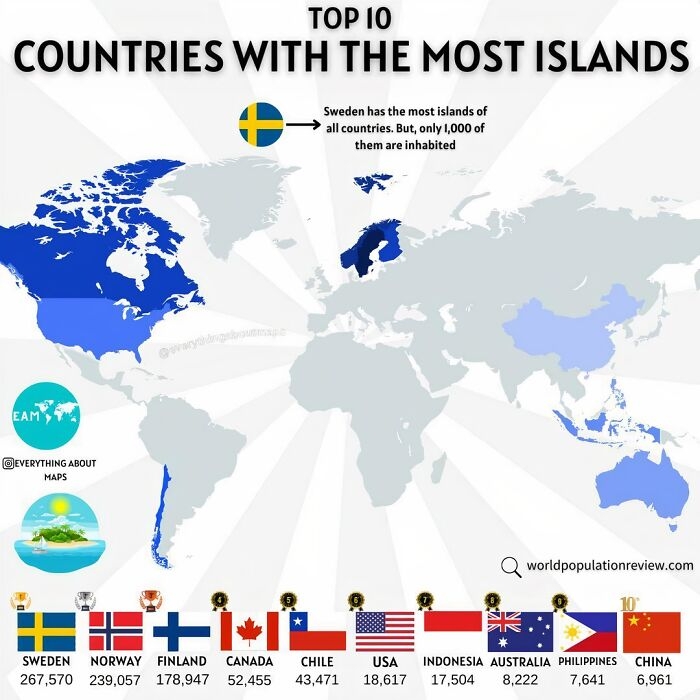 Image source: Agreeable-Bowler8077
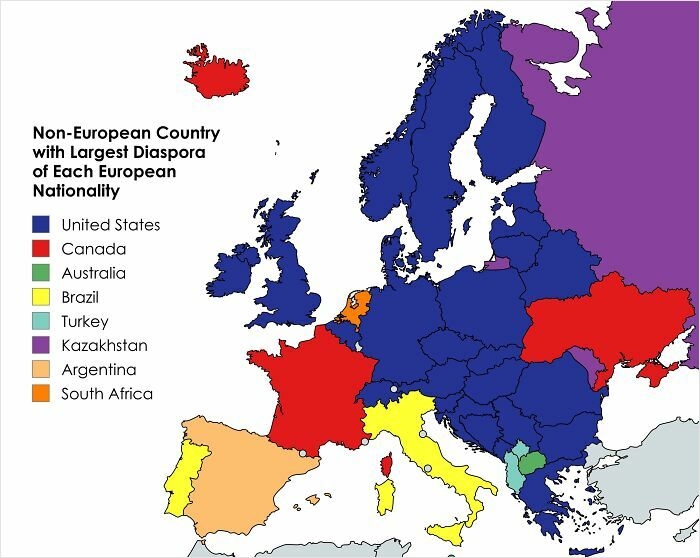 Image source: ExcitingNeck8226
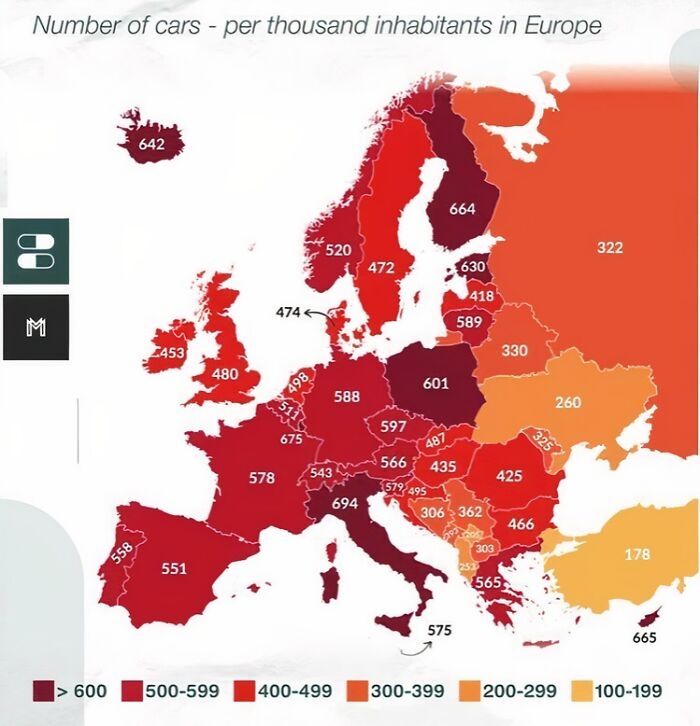 Image source: quindiassomigli
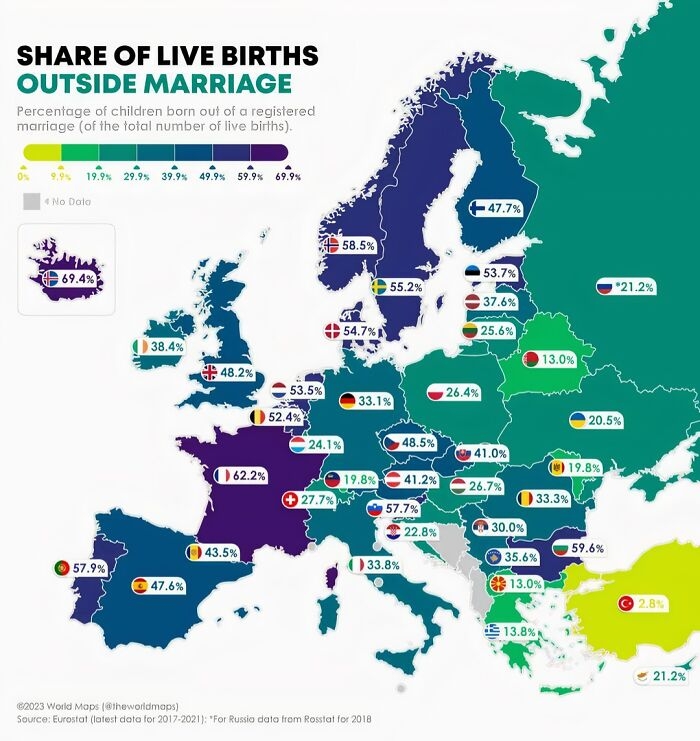 Image source: Junior_Insurance7773
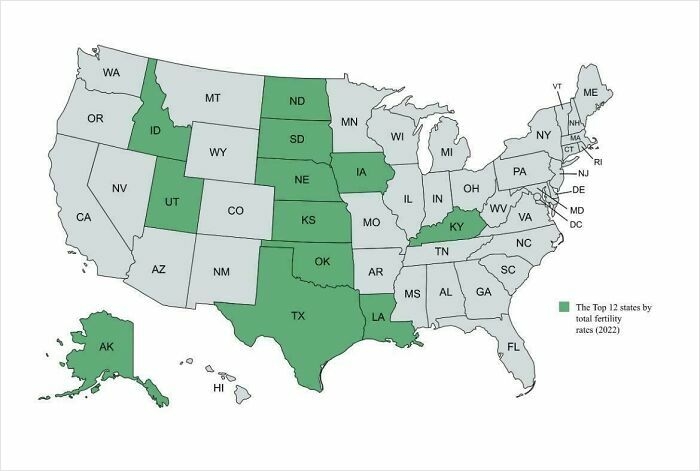 Image source: DeviceOk7509
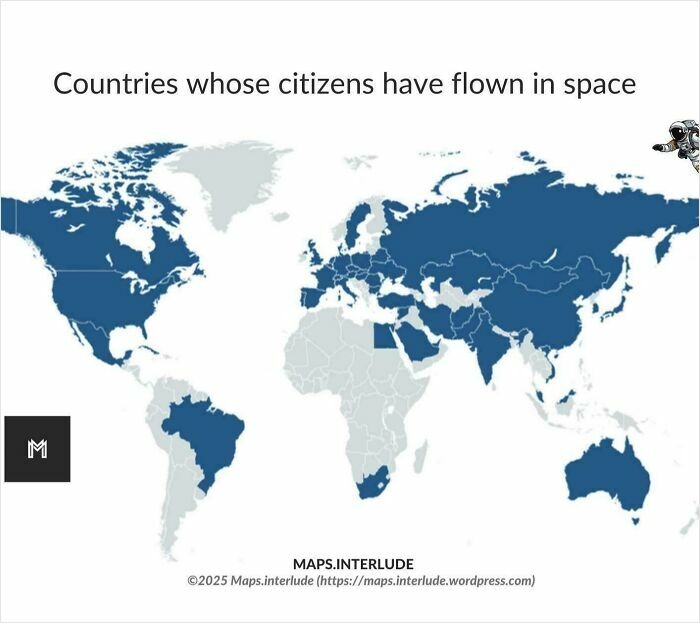 Image source: quindiassomigli
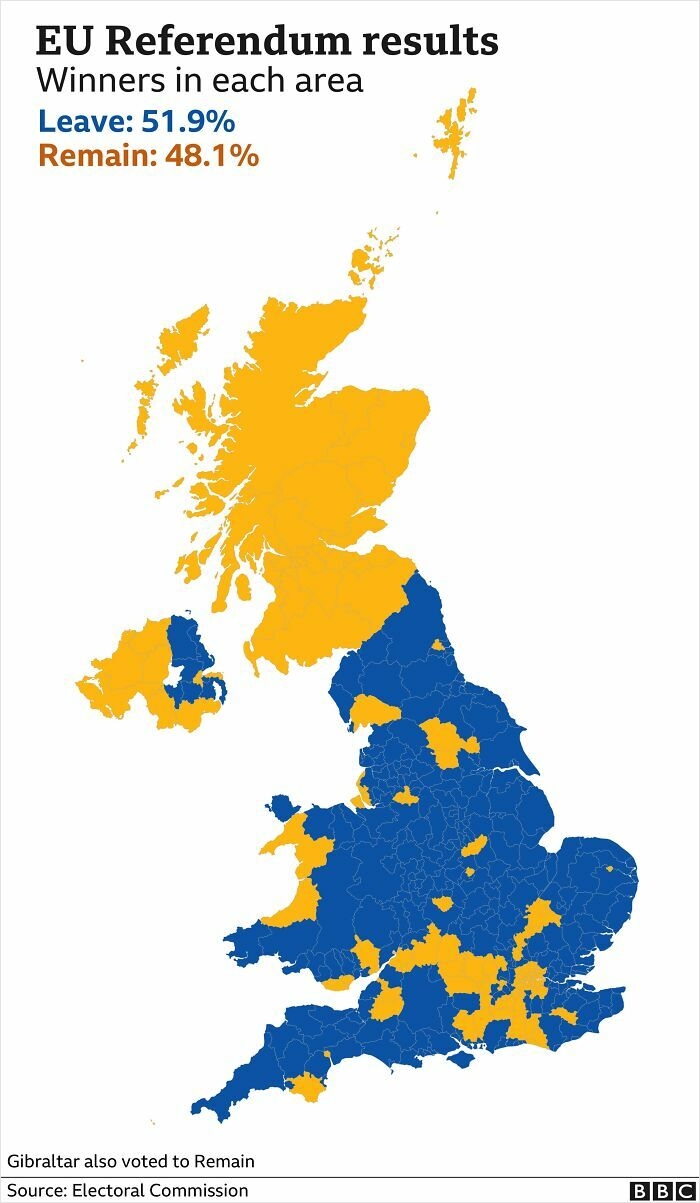 Image source: Objective-Resident-7
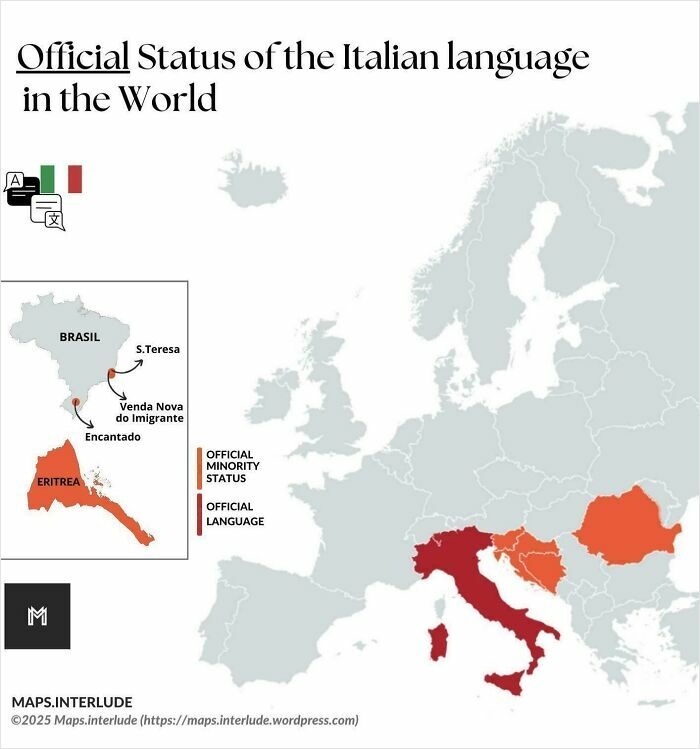 Image source: quindiassomigli
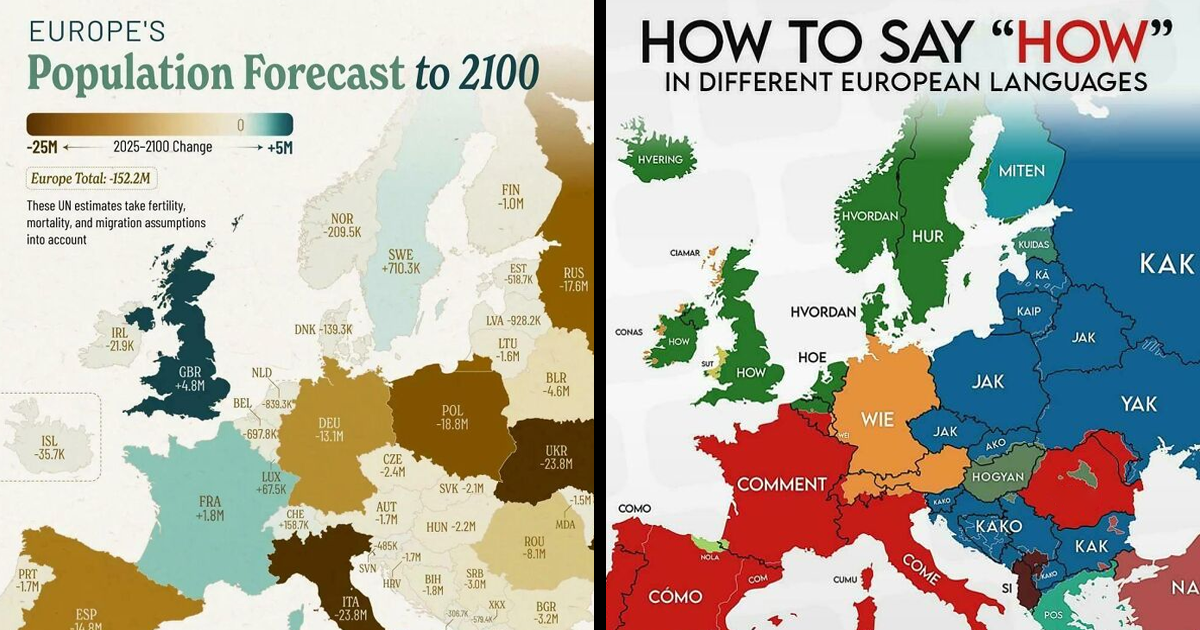
#1 Europe's Population Forecast To 2100
Image source: QuartzXOX
#2 How To Say "How" In Different Languages
Image source: montecristolord
#3 Tesla’s Decline In Europe
Image source: quindiassomigli
#4 Each U.S. State's Biggest Export Trading Partner
Image source: MansterSoft
#5 Second Most Spoken Language In Us States
Image source: Few_Introduction9919
#6 Raccoon Invasion Of Germany In The Past 30 Years
Image source: BrownRepresent
#7 Years Women Got Voting Rights In Middle Eastern Countries
Image source: throwaway4457877
#8 No Hurricane Has Ever Crossed The Equator
Image source: spyalien
#9 Share Of People In Europe That Want The Rich To Get Taxed More
Image source: Alarmed_Wish3294
#10 Countries Where Majority Of Population Is Born In 21st Century As Of February 2025 Based On Median Age
Image source: OppositeRock4217
#11 How Google Maps Labels The Gulf Of Mexico (Gulf Of America) In The Us, UK & Mexico
Image source: beavershaw
#12 A Town In Norway Is In Shadow For Six Months A Year
Image source: Vitboi
#13 "Liberation Day" Trump’s Tariffs On Europe
Image source: sh1kora
#14 Gdp Per Capita In Europe
Image source: Middle-Stuff1355
#15 State-Wise Railway Electrification In India
Image source: chipkali_lover
#16 Homeowners That Lock Their Doors In The U.S
Image source: LuckyTraveler88
#17 Has Your Nation's Population Increased Or Decreased Since 2000
Image source: ExcitingNeck8226
#18 Top 10 Countries With The Most Islands!
Image source: Agreeable-Bowler8077
#19 Non-European Country With Largest Diaspora Of Each European Nationality
Image source: ExcitingNeck8226
#20 Number Of Cars Per 1000 People In Europe
Image source: quindiassomigli
#21 Europe Live Births Outside Marriage
Image source: Junior_Insurance7773
#22 The Birth Belt: The U.s States With The Highest Fertility Rates
Image source: DeviceOk7509
#23 Countries Whose Citizens Have Flown In Space (As Of 2024)
Image source: quindiassomigli
#24 Brexit Vote Results
Image source: Objective-Resident-7
#25 Official Status Of The Italian Language In The World
Image source: quindiassomigliDE
Written by
Demilked Editorial
SaaS Review Specialist · Demilked
With 5+ years in the creator, entertainment, and publishing spaces, Demilked shortlists, reviews, and ranks leading tools that actually make your life easier.