20 Times Statistics And Numbers Were Turned Into Entertaining Data Through Infographics
These infographics blend information with entertainment.
Independently testedUnbiased Demilked scoreFree to implementTools included
Tired of boring textbooks and lengthy stats? What if we told you that learning new things can be fun by visualizing data in the form of charts and images? Infographics are now coming up as an engaging and effective way to share information.
The r/Infographics subreddit is an online community where folks share amazing infographics to educate and entertain people at the same time. Check out some of their best posts in the gallery below.
More info: Reddit
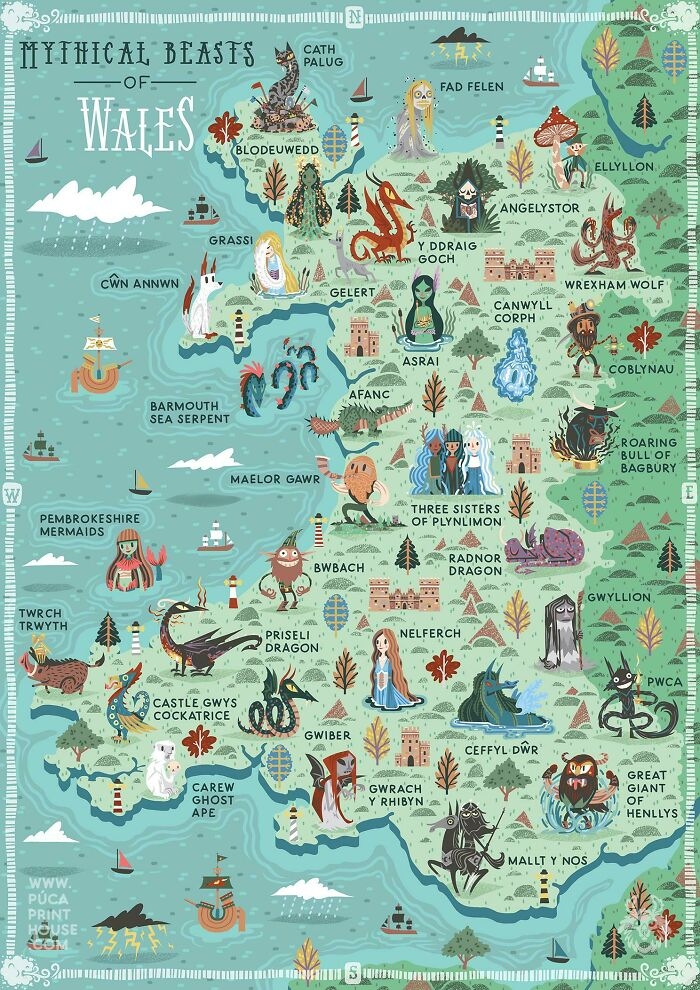 Image source: NeilParkinsonMakes
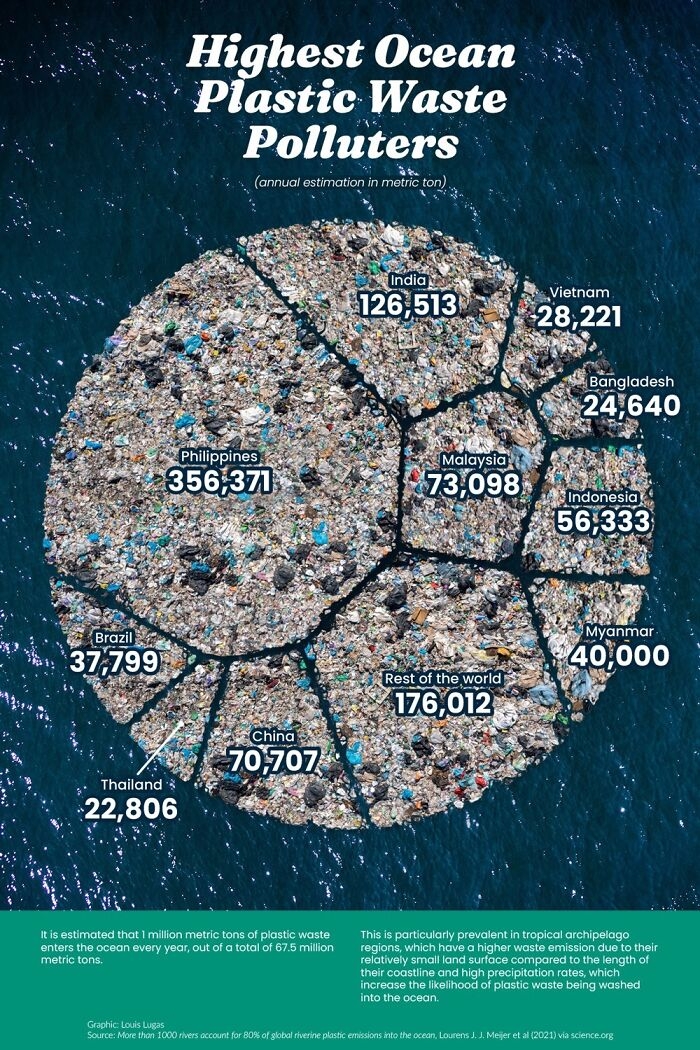 Image source: giuliomagnifico
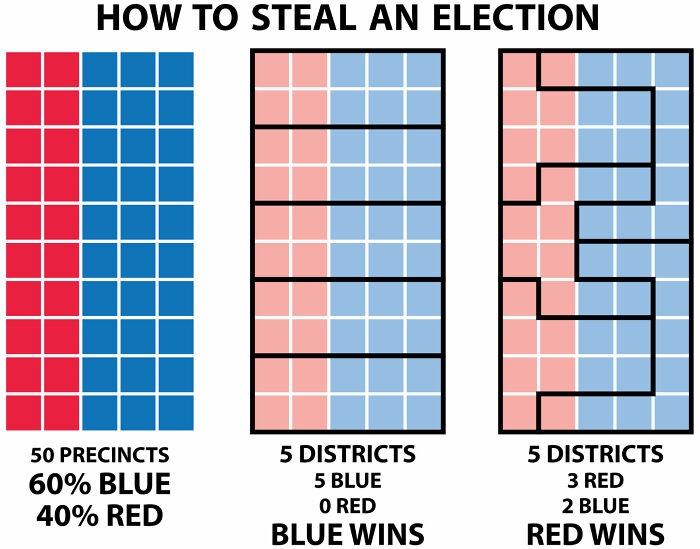 Image source: loodog
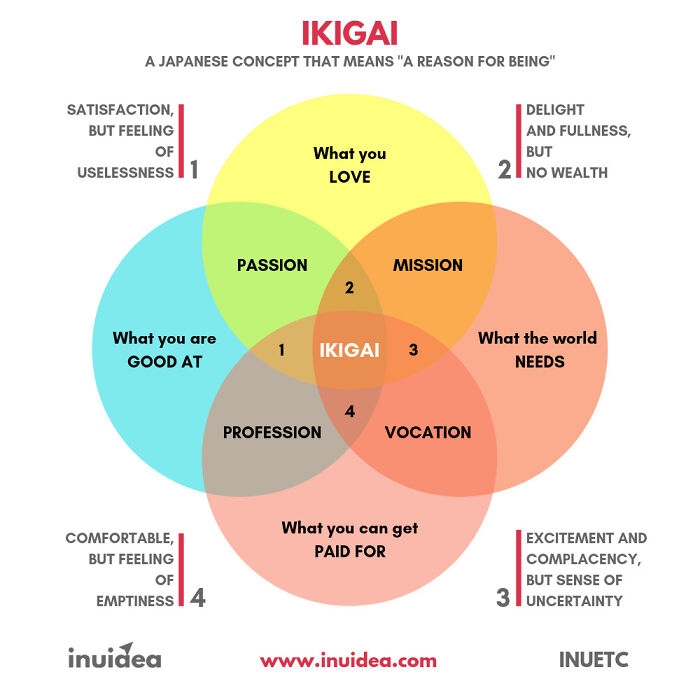 Image source: inuetc
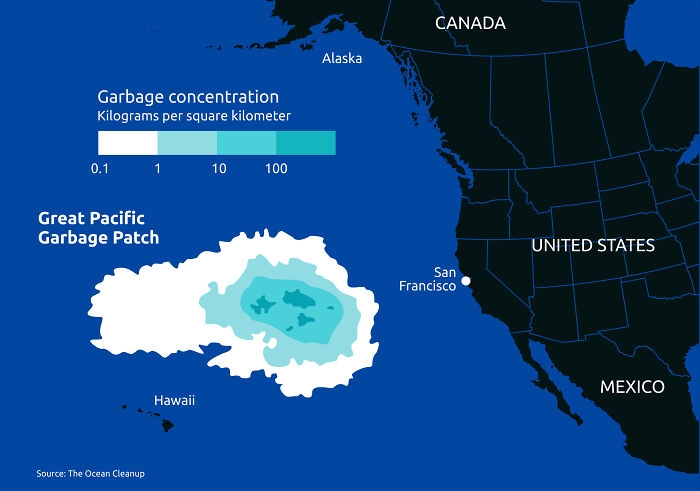 Image source: NoComplaint1281
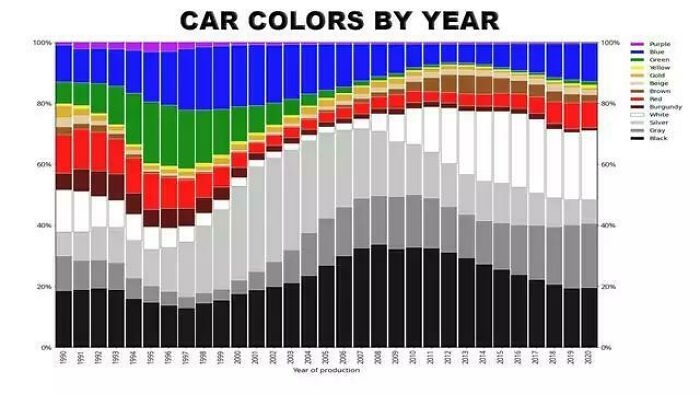 Image source: 100LittleButterflies
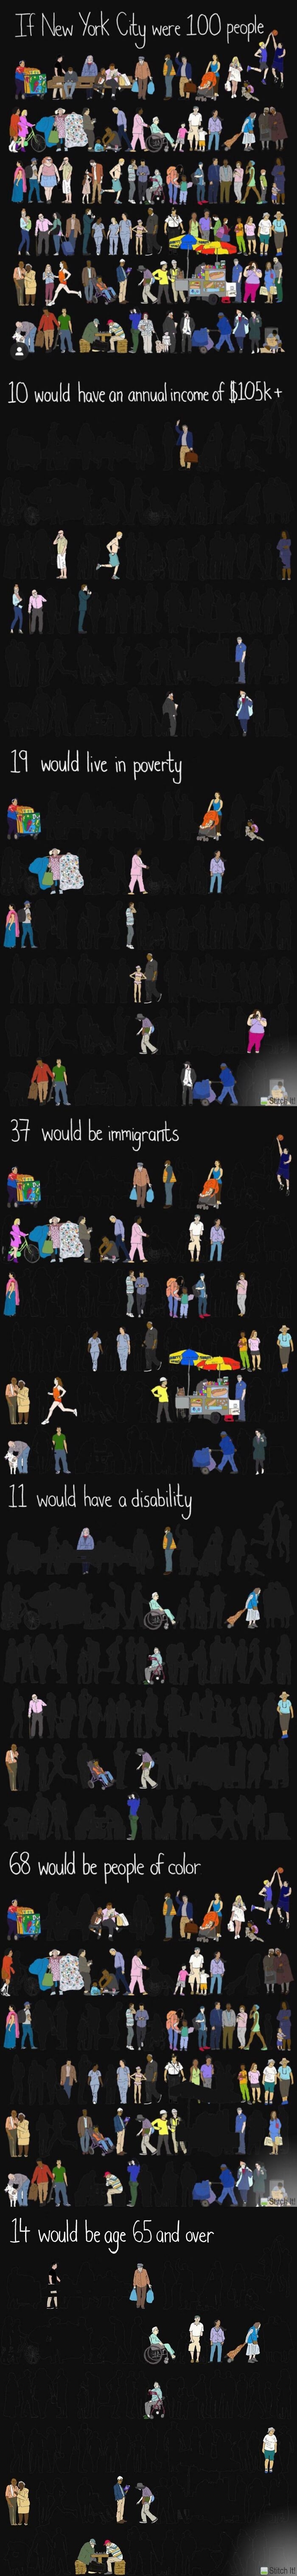 Image source: surfinThruLyfe
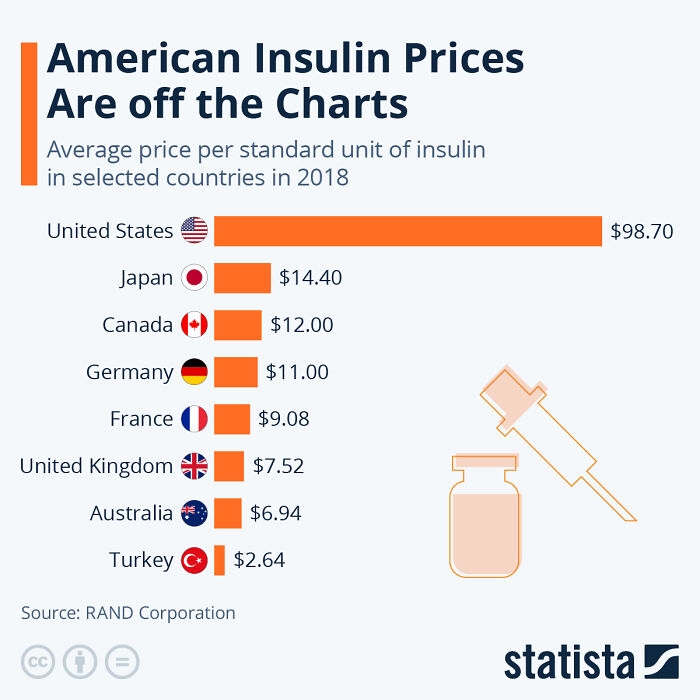 Image source: Big_Maintenance_1789
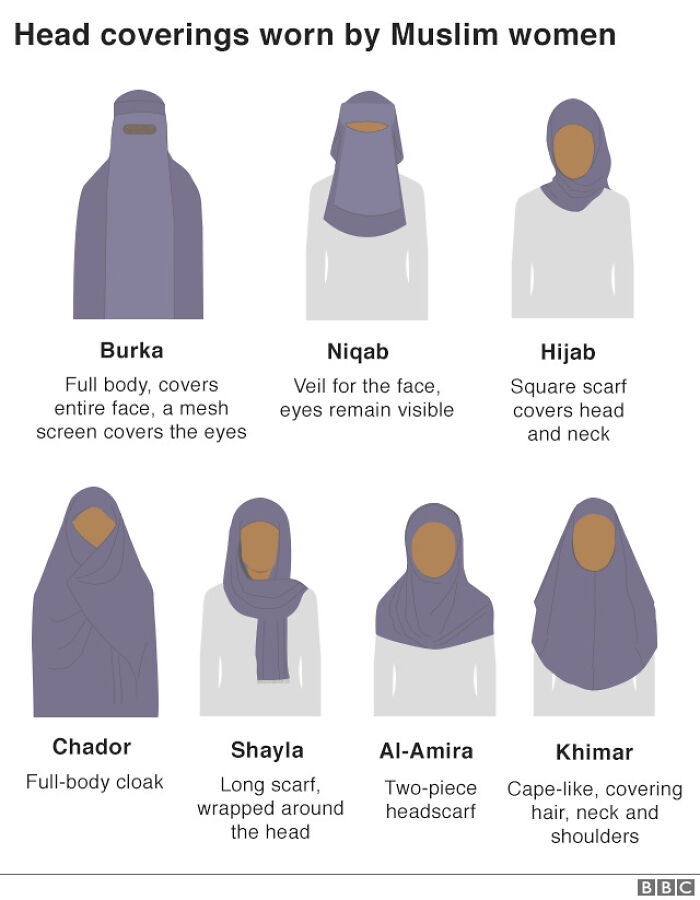 Image source: heavenlydigestion
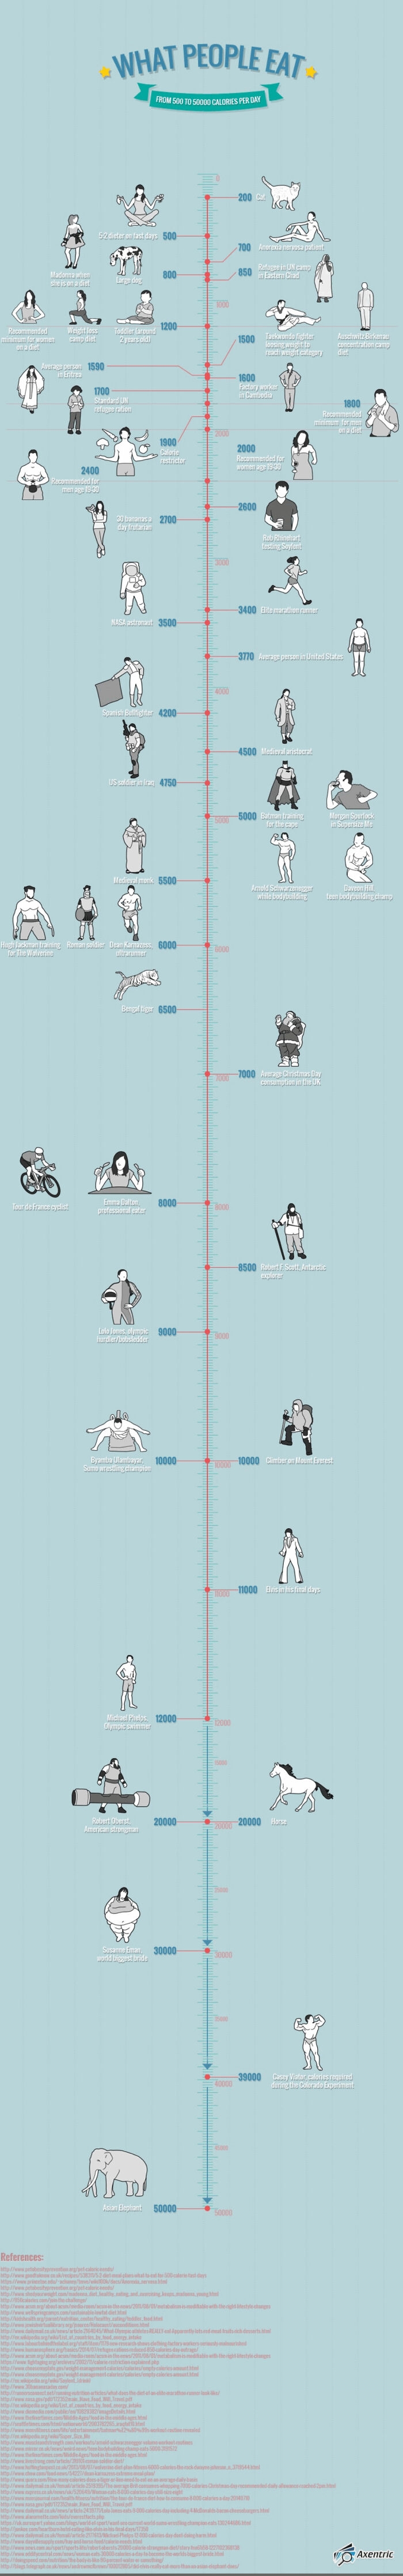 Image source: tarandfeathers
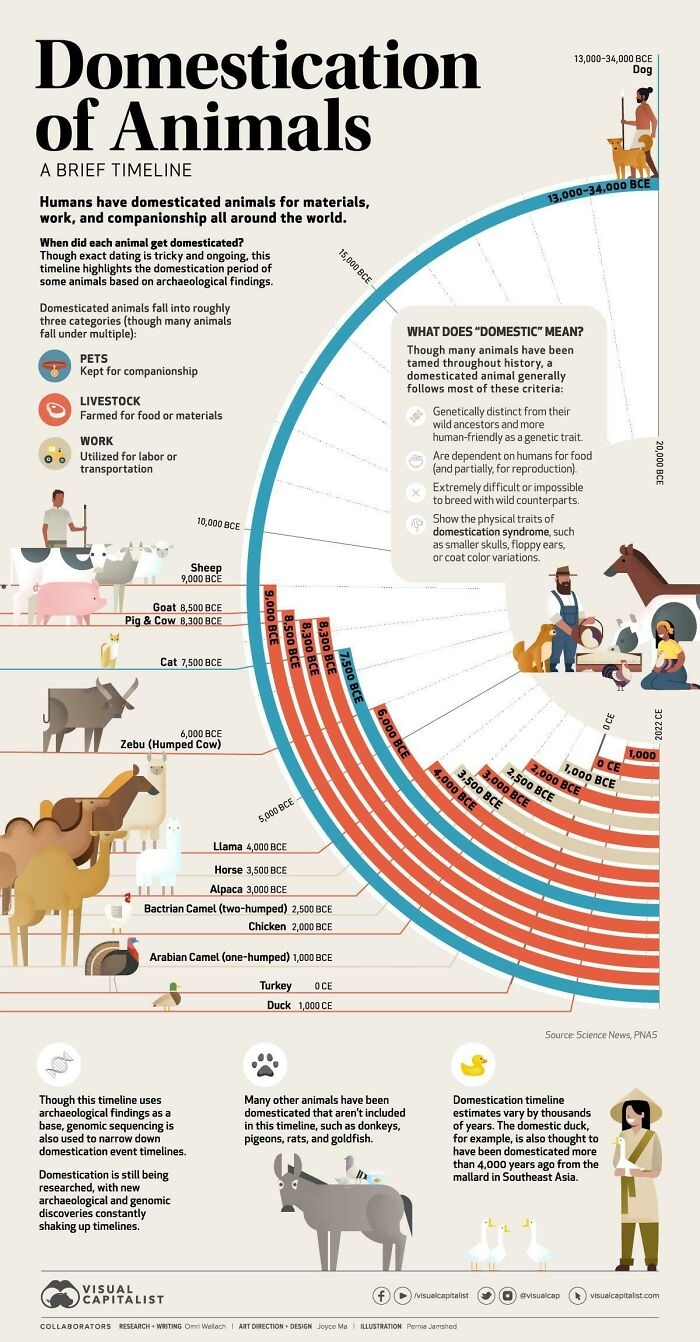 Image source: giuliomagnifico
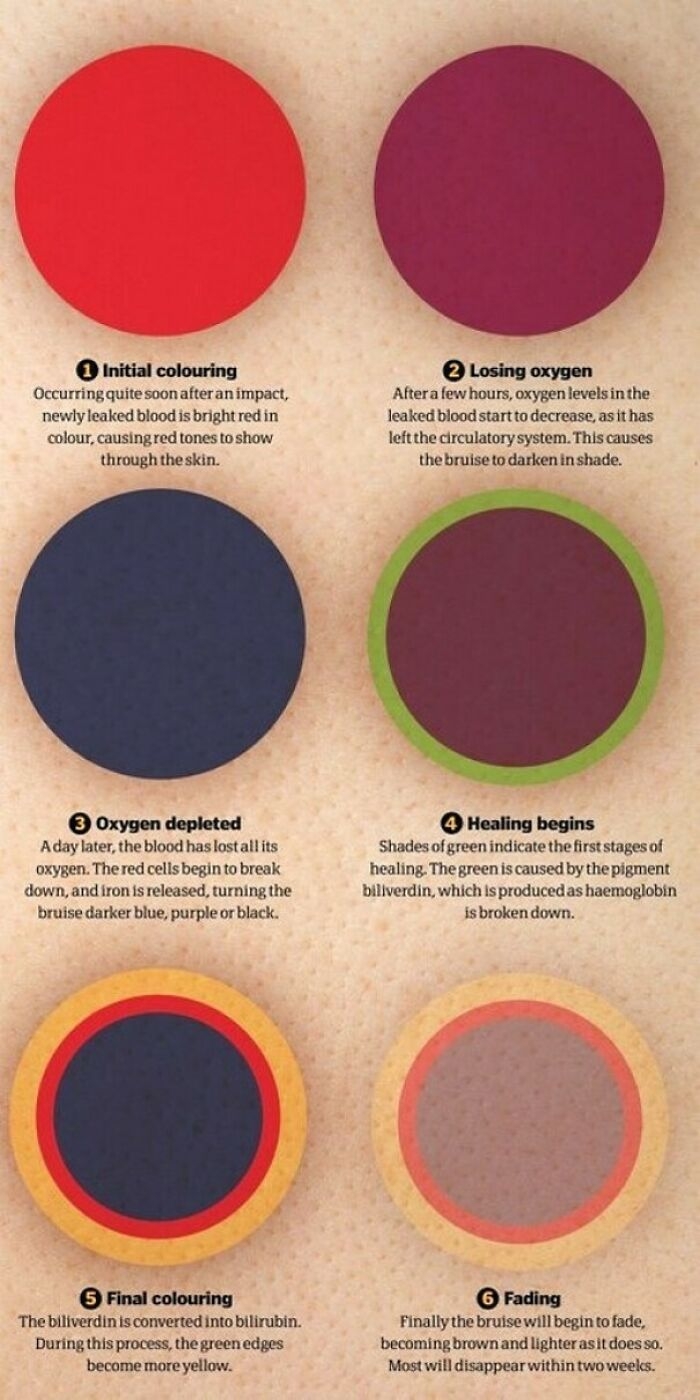 Image source: Dhorlin
 Image source: R3333PO2T
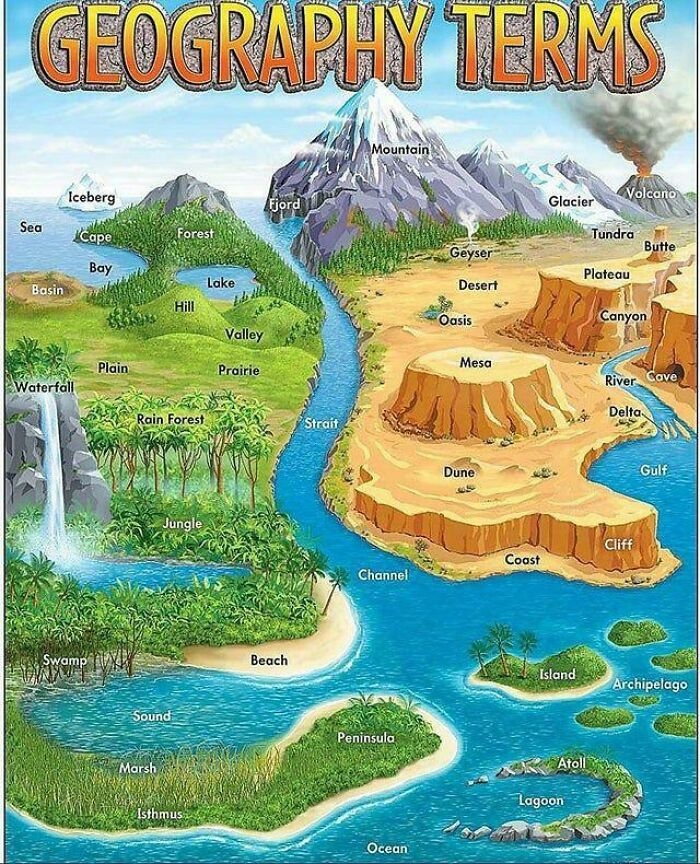 Image source: MrJones-
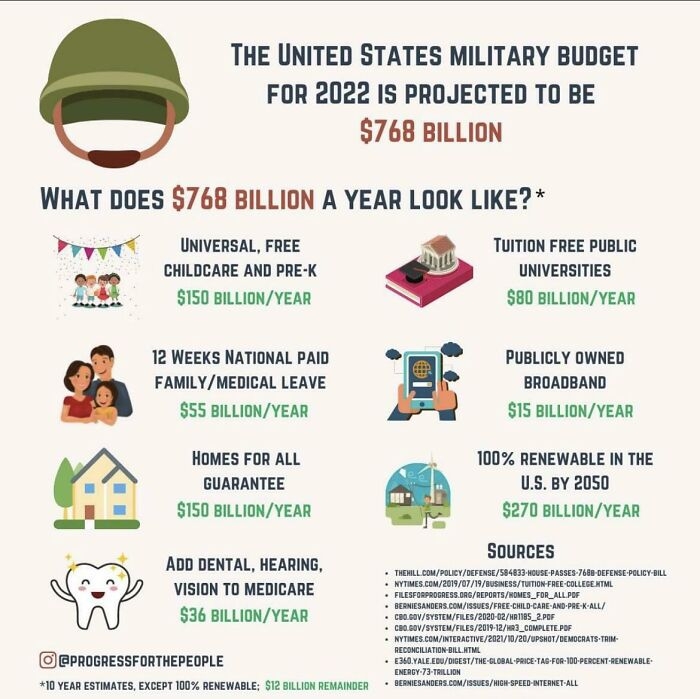 Image source: sillychillly
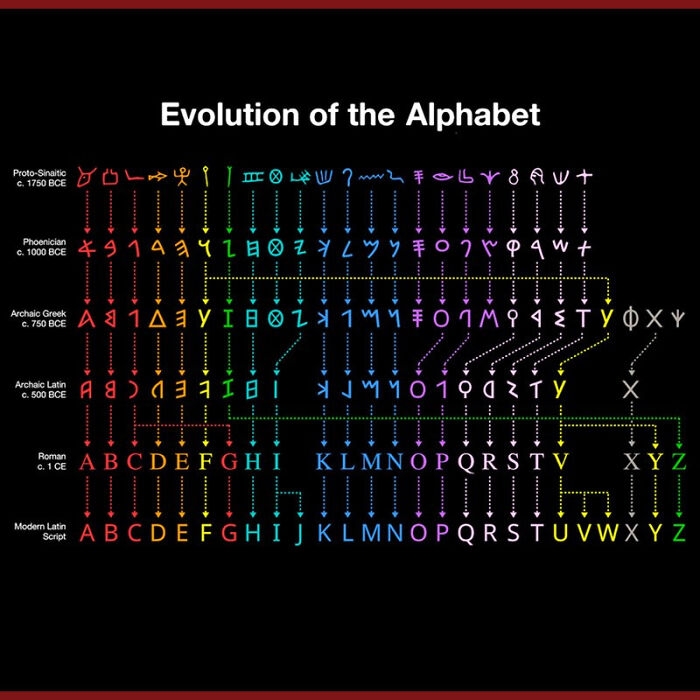 Image source: Lustikheimer
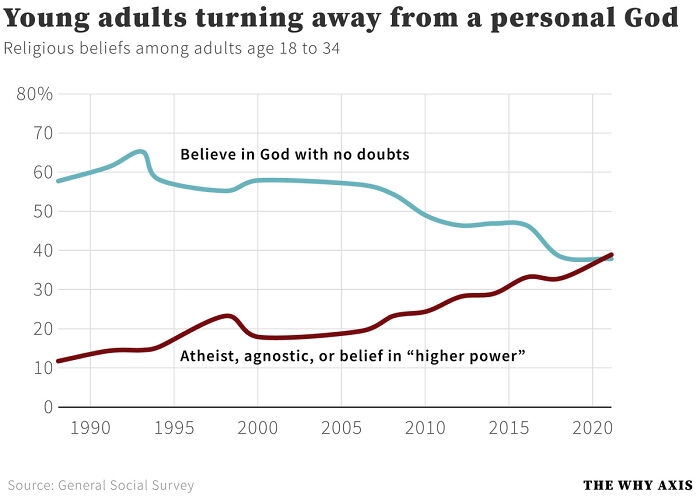 Image source: reddit.com
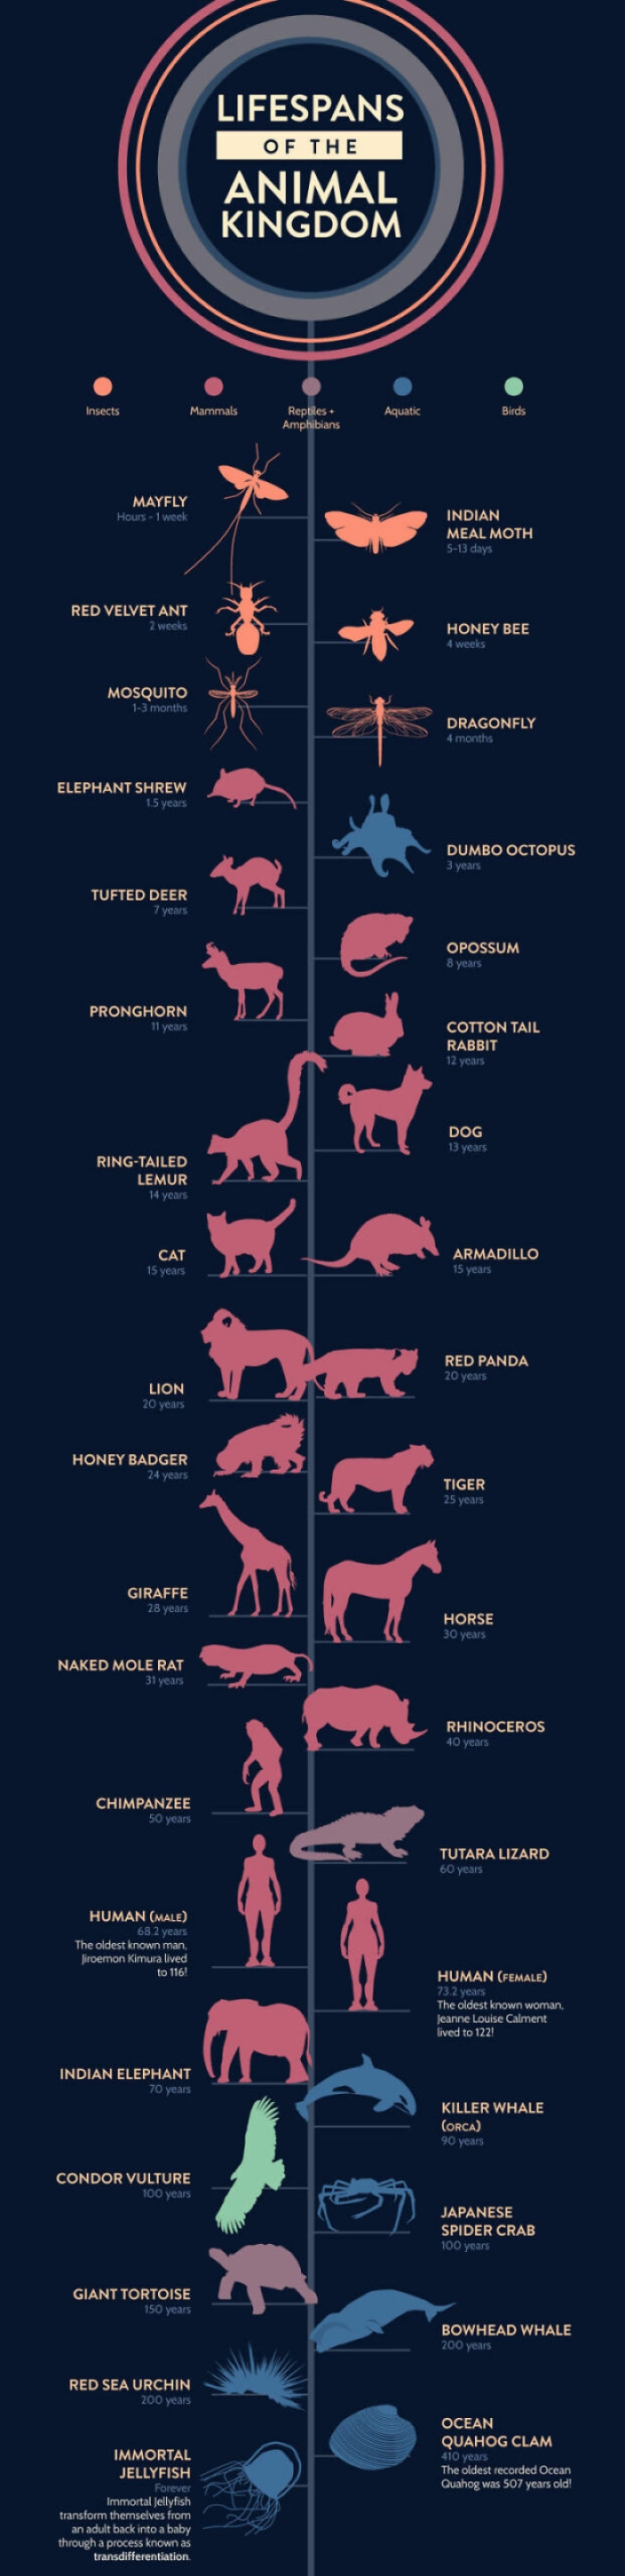 Image source: drbatookhanxx
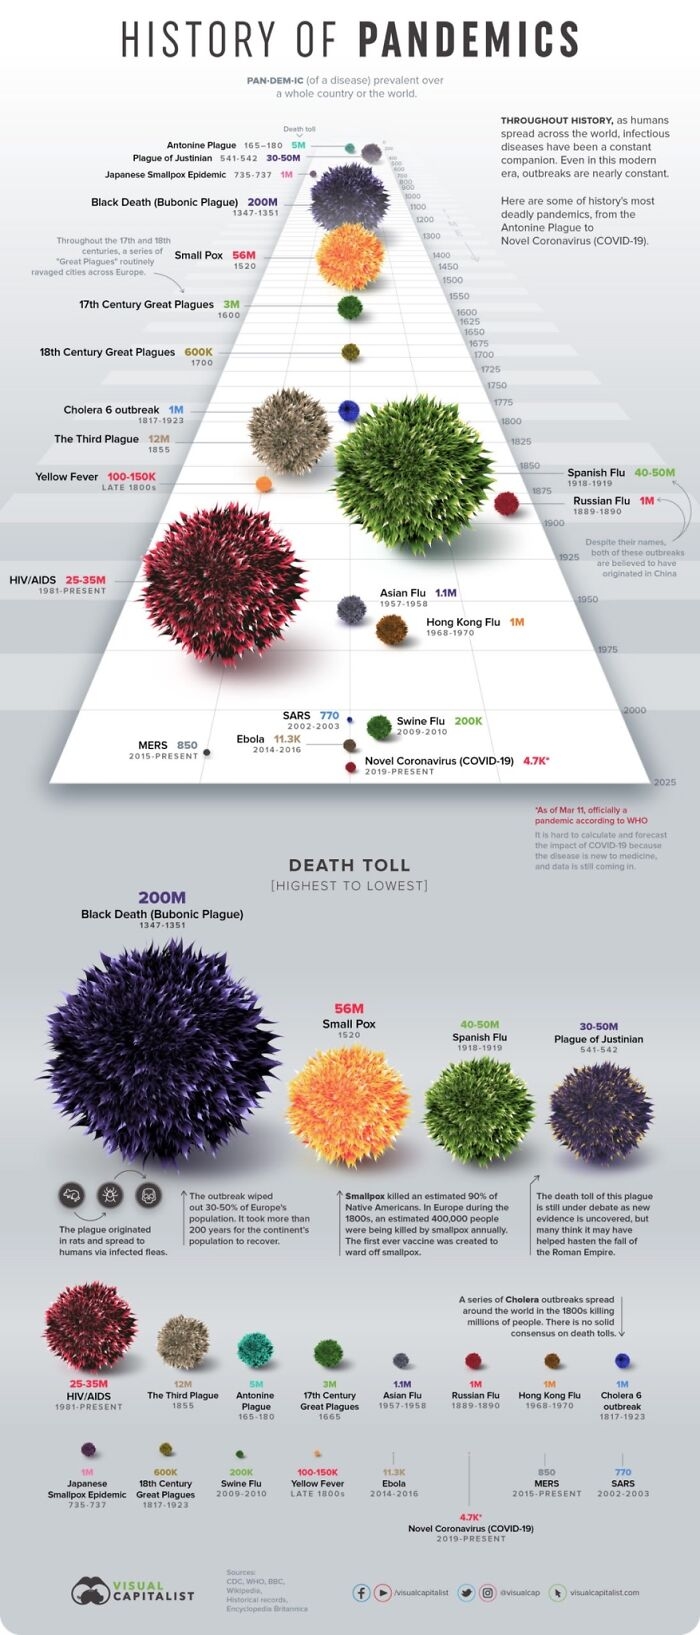 Image source: dartmaster666
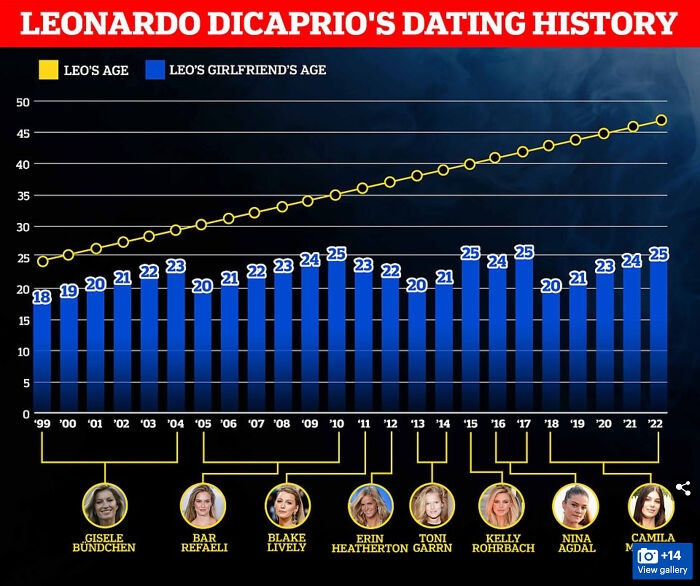 Image source: everywhere_anyhow
#1 Mythical Beasts Of Wales [oc]
Image source: NeilParkinsonMakes
#2 Highest Ocean Plastic Waste Polluters
Image source: giuliomagnifico
#3 Wikipedia's Illustration For Gerrymandering
Image source: loodog
#4 Ikigai: The Japanese Concept Of Finding Purpose In Life
Image source: inuetc
#5 The Size And Location Of The Great Pacific Garbage Patch
Image source: NoComplaint1281
#6 What Happened To Green Cars?
Image source: 100LittleButterflies
#7 If New York City Were 100 People (Nytimes)
Image source: surfinThruLyfe
#8 American Insulin Prices Are Off The Charts
Image source: Big_Maintenance_1789
#9 Head Coverings Worn By Muslim Women
Image source: heavenlydigestion
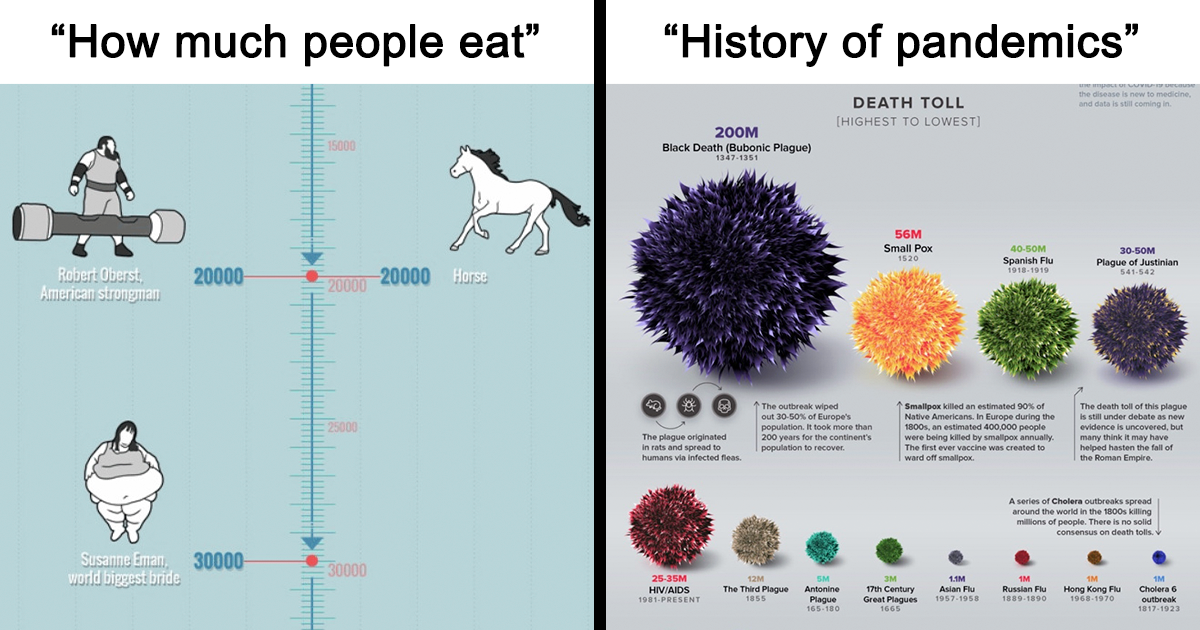
#10 How Much People Eat
Image source: tarandfeathers
#11 Timeline: The Domestication Of Animals
Image source: giuliomagnifico
#12 The Bruise Spectrum
Image source: Dhorlin
#13 If Only We Could Get One For Avocados
Image source: R3333PO2T
#14 Geography Terms
Image source: MrJones-
#15 We Could Fund Us…
Image source: sillychillly
#16 The Evolution Of Letters
Image source: Lustikheimer
#17 Decline Of Faith Amongst Young American Adults
Image source: reddit.com
#18 Lifespan Of Animals
Image source: drbatookhanxx
#19 History Of Pandemics
Image source: dartmaster666
#20 Leonardo Dicaprio's Dating History
Image source: everywhere_anyhowDE
Written by
Demilked Editorial
SaaS Review Specialist · Demilked
With 5+ years in the creator, entertainment, and publishing spaces, Demilked shortlists, reviews, and ranks leading tools that actually make your life easier.