
20 Engaging Infographics And Charts That Shed Light On Random Intriguing Subjects
Picture this: You’re staring at a bunch of boring numbers and complicated facts. Snooze-fest, right? But what if we told you there’s a magical way to turn all that dullness into something exciting and eye-catching?
The subreddit r/dataisbeautiful shares remarkable charts that are not only visually stunning but also have the potential to change your perspective on a wide range of topics. Get ready to be amazed by the beauty and impact of data! And if you ant more, check out our previous articles here, here, and here.
More info: kdnuggets.com | Linkedin | Twitter | Instagram | Facebook
#1 How To Mathematically Win At Rock, Paper, Scissors
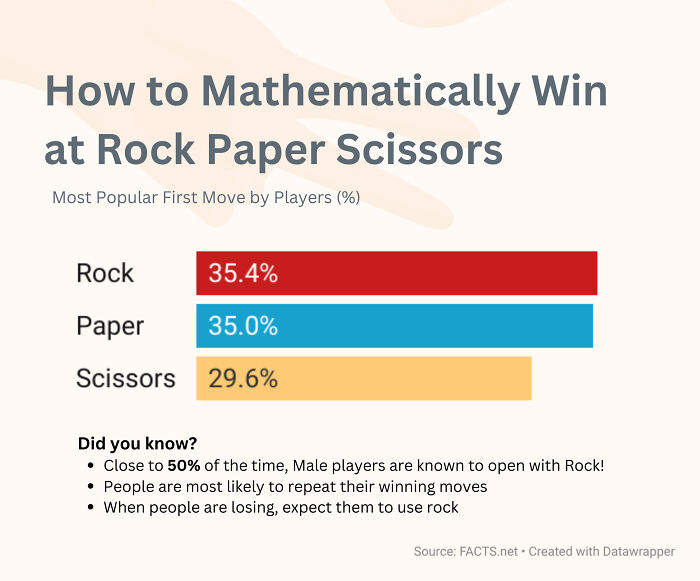
Image source: waynehihihi
#2 For The First Time, Fewer Than Half Of Americans Say They “Know God Really Exists” And Have “No Doubts About It”

Image source: cingraham
#3 The Most Streamed Programs
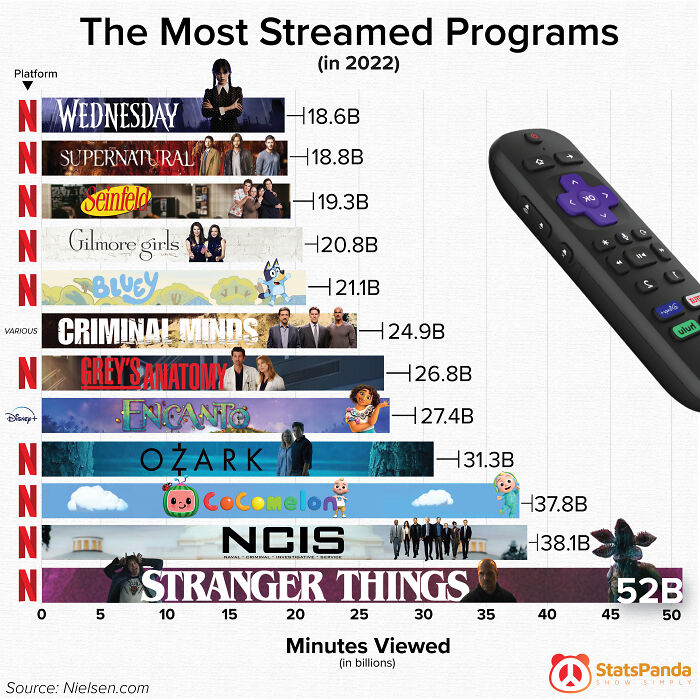
Image source: Dremarious
#4 Price Of Full Tank Of Gasoline (60 L) As A Percentage Of Average Monthly Net Salary Across The World

Image source: kiwi2703
#5 Dating In The Internet Age: 1995 vs. 2017
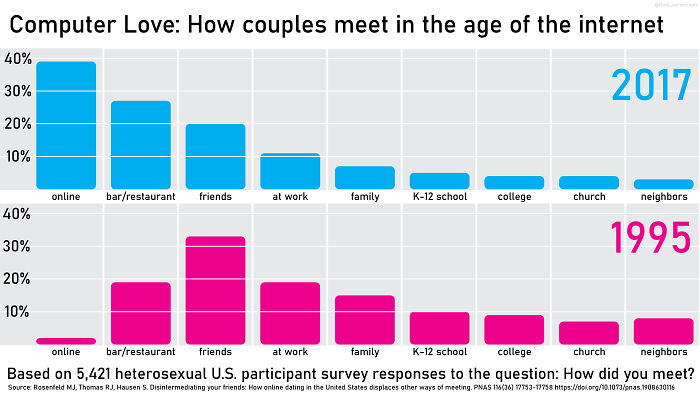
Image source: CognitiveFeedback
#6 I Asked 1000 People To Take Their Pic For Free On The Street

Image source: gonzalocdlp
#7 The Rise And Fall (And Rise) Of “Alexa”

Image source: CheeryOaf
#8 My 2-Month Long Job Search As A Software Engineer With 4 Yeo

Image source: a__side_of_fries
#9 A Comparison Of Nato And Russia’s Military Strength

Image source: arshadejaz
#10 The Cost Of Cable vs. Top Streaming Subscriptions

Image source: Dremarious
#11 The Percent Of Americans Who Believe Abortion Should Be Illegal (1975-2020)

Image source: thedataracer
#12 Actors/Actresses With The Most Oscar Wins

Image source: giteam
#13 If There Were Only 10 People On Earth, This Is How Wealth Would Be Distributed

Image source: rubenbmathisen
#14 The Share Of Latin American Women Going To College And Beyond Has Grown 14x In The Past 50 Years. Men’s Share Is Roughly Ten Years Behind Women’s

Image source: latinometrics
#15 Top Googled Games In Europe, December 2022

Image source: desfirsit
#16 How Long Ago Were The Hottest And Coldest Years On Record Around The World

Image source: neilrkaye
#17 Household Ownership Of Consumer Goods In India

Image source: pratapvardhan
#18 Japan’s Work To Reduce Homelessness

Image source: Xsythe
#19 Do You Belief In Ghosts?

Image source: GradientMetrics
#20 The Bedrock Geology Of North America

Image source: eon_james


Got wisdom to pour?